
Do People Buy More Lotto When Times Are Tough? What the Research Says

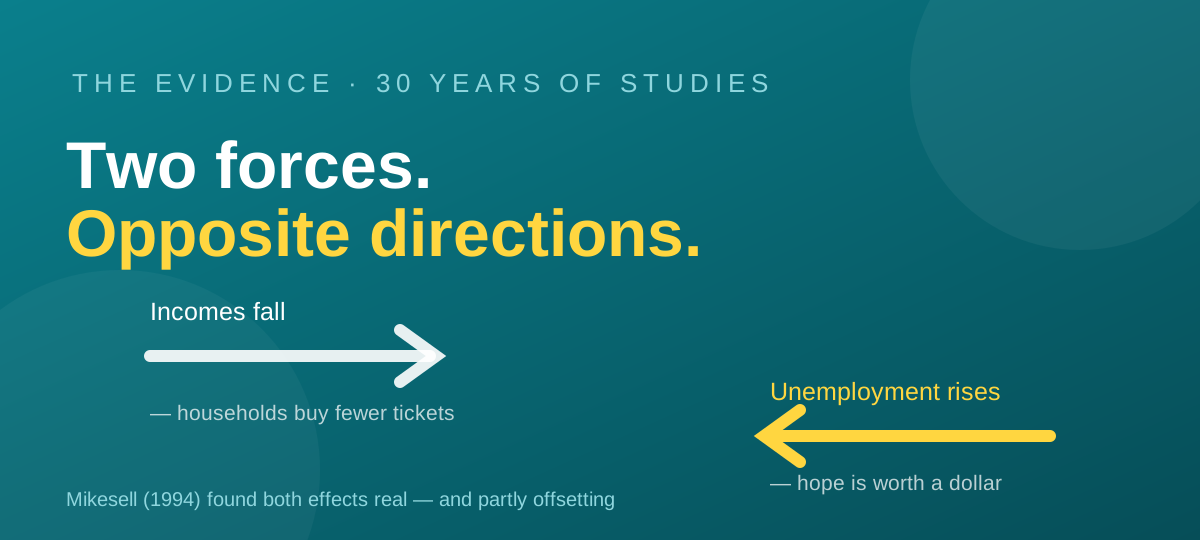
This is one of the few genuinely contested questions in lottery research, and it has been argued over by economists for more than thirty years. The short answer is that two strong forces pull in opposite directions, and which one wins depends on the country, the decade and - most of all - on how big the jackpot is that week.
The two forces, in one 1994 paper
The clearest framing comes from John Mikesell, a professor of public finance at Indiana University, writing in the National Tax Journal in 1994. He analysed quarterly per-capita lottery sales across US states from late 1983 to 1991 and found both effects at once.
On one side, income matters a lot: he measured a real income elasticity of about 3.9, meaning a 1 per cent fall in real income is associated with roughly a 3.9 per cent fall in lottery sales. On the other, unemployment pushes the other way: sales rose about 0.17 per cent for every 1 per cent rise in the unemployment rate - enough that unemployment moving from 4 to 5 per cent was associated with roughly a 4.25 per cent increase in quarterly sales.
His own summary of the mechanism is the line worth keeping:
"That pattern is consistent with the hypothesis that in recession people find more attractive the small chance of winning a huge lottery prize for the low ticket price. The unemployment rate relationship works as partial offset to the income relationship."
Two effects, both real, partly cancelling each other out. That is why the literature never settled.
The evidence that says yes, they buy more
A substantial body of work lands on the hope side.
Just and Gabrielyan (2017), researchers at Cornell, went finer than state averages. Using zip-code level data from Maine, they found that when the unemployment rate in a zip code rose by 1 per cent, lottery sales in that same area rose 4.7 per cent. Notably, the tickets that attracted newly unemployed players were the draw games with large rollover jackpots - not scratch tickets.
Horváth and Paap (2012) found US lottery sales growing substantially during recessions and largely unaffected by temporary income shocks. Capacci and co-authors (2017) reached the same conclusion using Italian data, reporting that gambling expenditure increases as overall economic conditions worsen. Olason and colleagues (2015) found gambling participation rose in Iceland during the recession that began in 2008.
The long-run version of the same finding comes from Blalock, Just and Simon (2004), who examined lottery sales across 39 US states over ten years and reported "a strong and positive relationship between sales and poverty rates".
And Eakins (2016) looked at how expenditure responded to the downturn and found the income elasticity of lottery spending actually fell between 2004-05 and 2009-10, from about 0.441 to 0.343 - meaning lottery spending became more rigid in the recession, not less. Her conclusion was that lottery expenditure behaves like a household necessity, one of the last things people cut.
The psychology behind it has a name. Emily Haisley, then a postdoctoral associate at the Yale School of Management, put it plainly:
"When people view themselves as doing worse financially, then that motivates them to purchase lottery tickets. People look to the lottery to get back to where they were financially."
There is even evidence that the demand is broader than money. Chew and co-authors (2021) found that lottery sales in China rose when air pollution worsened, describing the pattern as adversity increasing the demand for hope.
The evidence that says no
Now the other side, and it is not a fringe position.
In December 2008, at the worst point of the financial crisis, NPR interviewed Buddy Roogow, then director of the Maryland Lottery. His assessment could not have been blunter:
"There's a myth out there that in hard economic times, people will gamble more. There's no evidence of that."
He added: "We are not, as much as I would like to see it the other way, we're not a mandatory spend."
NPR's own reporting that month found that about three quarters of lottery states had seen sales decline. California was down 10 per cent in the first four months of its financial year. Washington DC was down almost 3 per cent. Massachusetts was projecting a shortfall of as much as $200 million. And notably, casino revenue in Las Vegas and Atlantic City was falling at the same time - the money simply was not being spent on gambling at all.
Why two honest accounts of the same crisis disagree
Look closely at the dates and the contradiction explains itself. In September 2008, the New York Times reported that of the 42 states with lotteries, at least 29 had increased sales in their most recent fiscal year, and 22 of those set records. Massachusetts hit a record $4.7 billion. In December 2008, three months later, NPR reported three quarters of lottery states declining.
Both were right. The fiscal years being compared were different, and the crisis deepened through the autumn. A generous reading is that early-recession lottery spending held up and then cracked as the downturn lengthened.
But there is a bigger confound sitting on top of all of this, and it is the one most articles ignore: jackpot size. Lotto NZ's own reporting shows Powerball jackpot activity accounts for the great majority of its revenue, and researchers have repeatedly found that the size of a rollover jackpot moves sales more than price or expected value does. Peel (2010) found jackpot size influenced sales more than expected returns did. A record jackpot can lift sales in the middle of a recession; a run of small ones can depress them in a boom. Economic conditions are only one input.
Rebecca Hargrove, president of the Tennessee Lottery, gave perhaps the most useful explanation of why the habit survives at all:
"I've noticed that if there's a recession or a downturn in the economy, people cut back: it might be on the new car, the new house or the new fridge. But the average player spends $3 to $5 a week on lottery tickets, and it's a pretty benign purchase."
A car purchase can be deferred. A $4 weekly habit is not what most households cut first - which is exactly why the aggregate numbers are so unstable.
What New Zealand's own numbers show
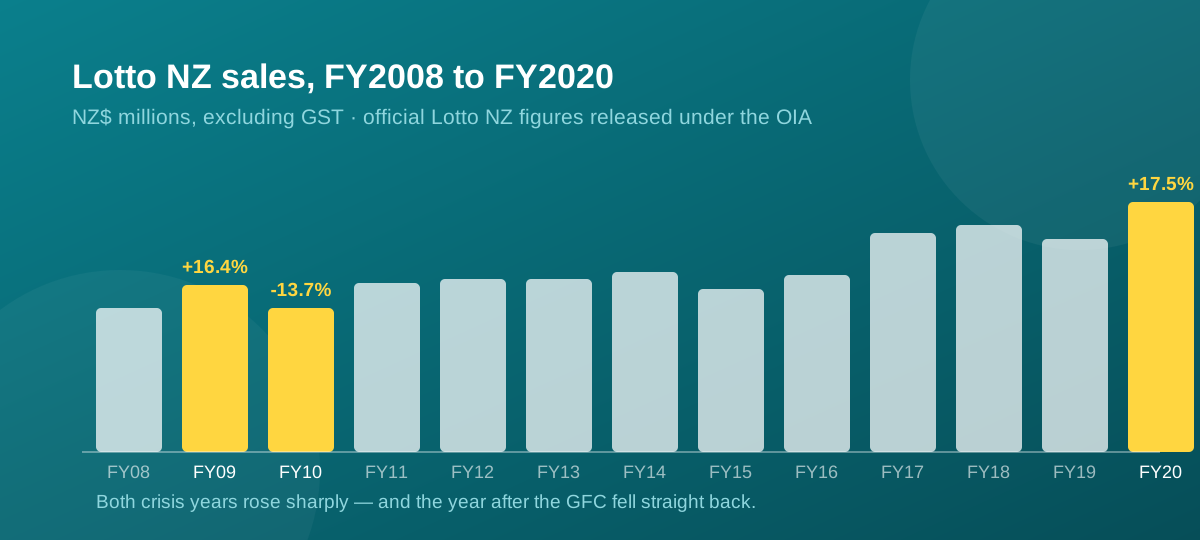
We do not have to rely on overseas studies, because Lotto NZ's sales history is public. Here it is, in NZ$ millions excluding GST:
| Financial year | Sales (NZ$m, excl. GST) | Change |
|---|---|---|
| FY2008 | 750 | - |
| FY2009 | 873 | +16.4% |
| FY2010 | 753 | -13.7% |
| FY2019 | 1,113 | - |
| FY2020 | 1,308 | +17.5% |
Read that table honestly and you get both answers.
FY2009 is a point for the hope side. That was the year the global financial crisis hit hardest, and Lotto NZ sales jumped 16.4 per cent. The year after, they fell 13.7 per cent. Then, in FY2020, the first pandemic year, sales rose 17.5 per cent - another crisis, another increase.
FY2025 is a point for the other side. Recent years are reported on a different basis - figures since then include GST, so they are not directly comparable with the table above - but the direction is not in doubt. Lotto NZ set a record $1.71 billion in the year to June 2024, then fell about 5 per cent to $1.63 billion in the year to June 2025, a period defined by cost-of-living pressure. That is what the income effect predicts, with no visible offset.
The honest conclusion for New Zealand is that there is no single pattern here. Two crisis years rose sharply; the most recent pressure year did not. Anyone who tells you confidently that hard times mean more Lotto sales has picked half of the evidence.
What this means for you
There is a genuinely useful lesson buried in the research, and it is not about predictions.
The studies that find lottery spending rising in hard times are not describing a good outcome. They are describing a regressive pattern - the same one Blalock, Just and Simon measured when they linked sales to poverty rates. Lottery spending takes a larger share of a small income than a large one, and it is the first place people go when they feel they are falling behind. Several researchers have described this as an implicit tax, and it is the most regressive one in the book.
If you notice your own spending drifting up because money feels tight, that is the exact pattern the literature warns about - and the one part of it you actually control. A fixed weekly amount does more for your position than any read on the economy.
And the honest summary of the research is narrower than either camp claims. Economic conditions do move lottery sales, in both directions, and the strongest single driver of all is a number that has nothing to do with the economy: how big the jackpot is when you walk past the counter.
If gambling has stopped being entertainment for you or someone close to you, Gambling Helpline NZ is free, confidential, and available 24/7 on 0800 654 655.

Fancy your own set of numbers?
I'll pick 30 fresh lines for the next draw — hot, balanced and wild card.