
Has Anyone Actually Studied Which Lotto Numbers People Pick?

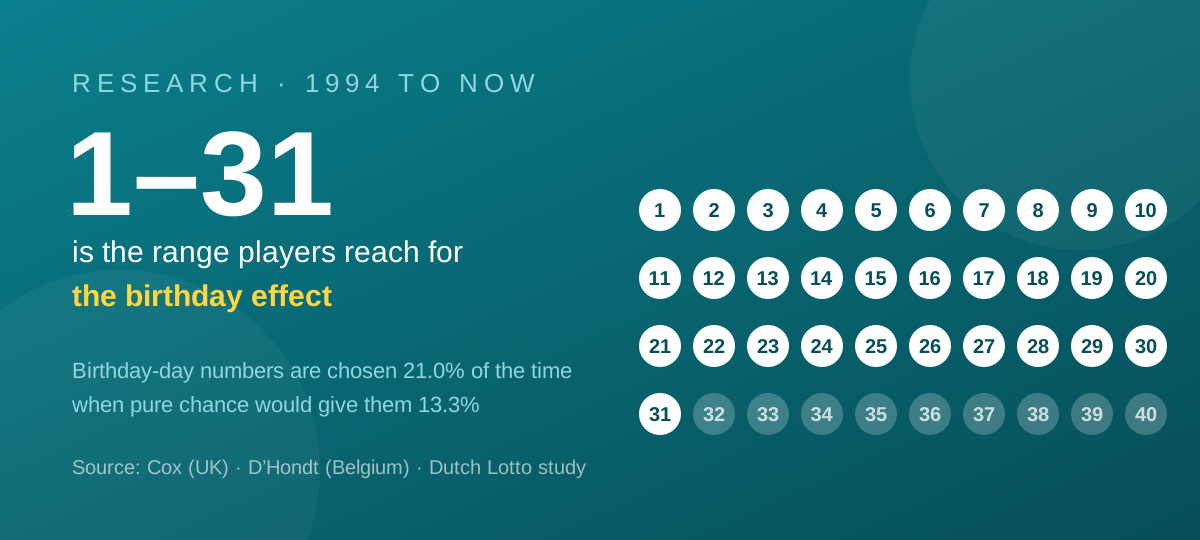
This is one of those questions where the answer is yes, and more thoroughly than most people expect. The habit of picking birthdays has been measured across at least four countries, with data going back to the very first year the UK National Lottery ran. Nobody had to guess.
Researchers never ask anyone. They count winners instead
You would think the evidence came from surveys. It mostly did not, and the reason is sensible: ask players what numbers they use and you get a small, self-selecting, slightly embarrassed sample.
So researchers went at it sideways. Every draw produces not just winning numbers but counts of how many lines matched four, five or six of them. If a combination comes out and an unusual number of people matched four or five numbers, that tells you the combination was written down by a lot of players. Put enough draws through that filter and you can rank every number on the board by popularity without asking a single person anything.
Three studies that found the same thing
Simon Cox, University of Southampton (published in The Statistician, 1998). Cox analysed the first 113 draws of the UK National Lottery, comparing winning numbers against the match counts. Number 7 was chosen roughly 25 per cent more often than the least popular number, 46. Fourteen and eighteen were also over-picked. Forty-four and 45 sat near the bottom.
But the loudest signal was not any single number. It was a clear preference for everything up to 31. Cox had a name for it: "They call this the birthday effect. A lot of people use their date of birth."
His analysis turned up other human fingerprints too. Players favour numbers clustered in the middle of the ticket form - the layout itself steers the hand. Plenty simply draw a diagonal line across it. And there is a marked dislike of consecutive numbers, even though 1-2-3-4-5-6 comes up exactly as often as any other six-number combination.
Catherine D'Hondt, UC Louvain (Journal of Gambling Studies). D'Hondt's team studied 498 people playing Belgium's Lotto, where six numbers are drawn from 1 to 45. If picks were random, roughly four of those six would sit below 30. Her players averaged 4.7. She describes birthday picking as "a sub-optimal way to choose numbers".
Her data also found a gender split worth noting: 65 per cent of women used their birthday among their numbers, against 55 per cent of men.
The Dutch Lotto study, using 5.1 million individual combinations. This one measured pick rates directly rather than inferring them:
| Kind of number | How often chosen | If picks were random |
|---|---|---|
| Day of birth | 21.03% | 13.3% |
| Month of birth | 17.94% | 13.3% |
| Birth year (last 2 digits) | 17.97% | 13.3% |
| The player's age | 15.36% | 13.3% |
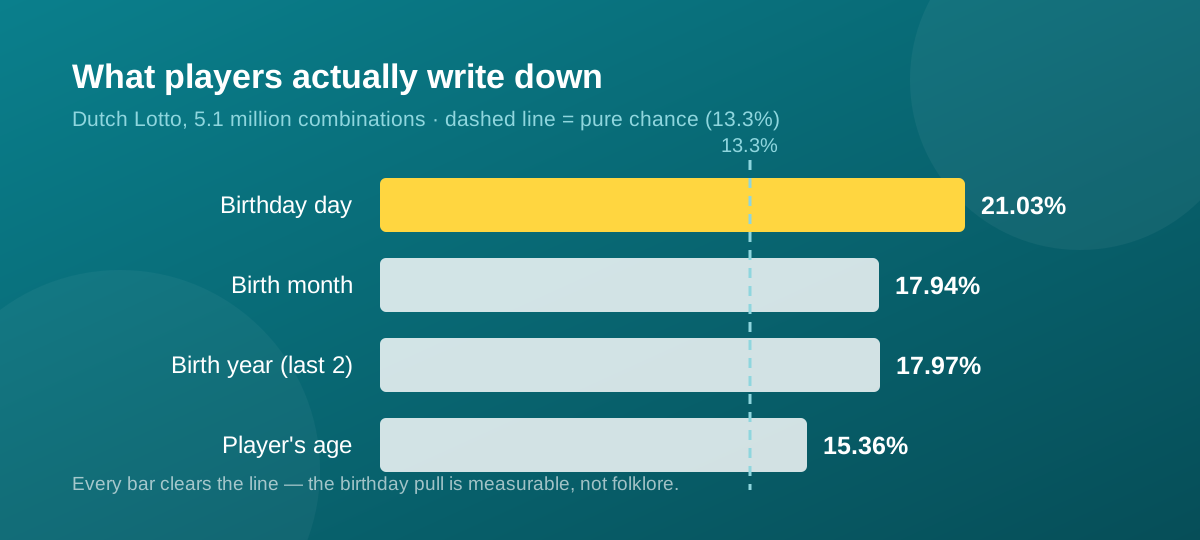
Every single category clears the line, and day-of-birth clears it by more than half again. Comparable studies on the US, Swiss and Canadian lotteries have landed in the same place.
Why we are wired to do it
Two well-documented effects explain the pull, and neither is a character flaw.
- Implicit egotism - we gravitate towards things that resemble us (Pelham, Carvallo and Jones, 2005). Your birthday is the most "you" number available on a Lotto form, so it feels like your number rather than one of forty.
- The illusion of control - Ellen Langer's 1975 experiments famously showed that people value lottery tickets they chose themselves more highly than identical tickets handed to them, even when the odds are indistinguishable.
Neither effect changes a single probability. They just change what we write in the boxes.
What this means for a New Zealand ticket
Here is the part that is specific to our game, and it cuts both ways.
Main numbers run 1 to 40, but calendar-based picking only reaches 31. That leaves nine numbers - 32 to 40 - that are structurally under-picked by anyone reaching for a birth date. That is roughly a quarter of the board going relatively unwanted.
Powerball is the opposite story. The Powerball pool is 1 to 14. Every Powerball number sits inside the birthday range already, so there is no above-31 corner of the Powerball board to retreat to. If you are thinking about how many other lines might be sitting on the same number, Powerball offers no hiding place at all.
And the constant that never moves: none of this changes your chance of winning. The odds of a single line taking Powerball Division 1 are about 1 in 53.7 million, whether you play 1-2-3-4-5-6 or the least popular six numbers on the board. What the research changes is only what happens after the numbers land - how many other lines are standing on the same combination. That is the whole mechanism behind why birthday numbers can cost you a share rather than a win.
The honest summary
Thirty years of data says the birthday effect is real, measurable and international. It says nothing whatsoever about which numbers will come up on Wednesday. The studies are a description of a human habit, not a forecast.
If your numbers are birthdays, you are in excellent company - and you now know one genuinely useful thing: that whether numbers are "due" is not a thing, but how many people share your combination is. Both facts are worth having. Neither one is a reason to spend more than you planned.
If gambling has stopped being entertainment for you or someone close to you, Gambling Helpline NZ is free, confidential, and available 24/7 on 0800 654 655.
Quick answers
Has anyone actually researched which numbers Lotto players pick?
Yes, and repeatedly. Simon Cox at the University of Southampton analysed the first 113 UK National Lottery draws and found number 7 was chosen about 25 per cent more often than the least popular number, with a clear preference for everything up to 31 - the pattern known as the birthday effect. Catherine D'Hondt at UC Louvain studied 498 Belgian players, and a Dutch study of 5.1 million combinations measured birthday-day numbers being picked 21.03 per cent of the time against 13.3 per cent by chance. US, Swiss and Canadian studies have found the same thing.
How can researchers know which numbers are popular without asking players?
They count winners rather than asking questions. Every draw records how many lines matched four, five or six numbers. If a drawn combination produces an unusually high number of near-misses, that combination was clearly written down by a lot of people. Comparing those counts against what randomness predicts lets researchers rank every number by popularity without surveying anyone.
Does this research mean I should avoid birthday numbers?
No - it describes a habit, not a winning strategy. Your chance of matching the numbers is identical whatever you play: about 1 in 53.7 million per line for Powerball Division 1. What popularity changes is only the sharing. If a drawn combination includes several numbers below 32, more lines will match it and the pool-based divisions are split more ways. You are not less likely to win with birthdays - you are marginally more likely to share if you do.

Fancy your own set of numbers?
I'll pick 30 fresh lines for the next draw — hot, balanced and wild card.