
NZ Lotto Results History: Year-by-Year Data From 2012 to 2026

What is in this archive and what is not
This archive provides a full and detailed record of New Zealand Lotto results from 2012 through 2026. That includes the number of draws held each year, how many draws produced a Powerball jackpot winner, and the largest single share of the jackpot in each year. It is important to note that this archive covers only these years with full prize details — earlier years such as 2001 to 2003 only have draw numbers and winning numbers without prize information.
The archive is not completely without gaps: draws 1326-1334 from late 2012 and draws 2187-2196 from mid 2022 are missing. So data from those missing draws should not be considered here. These gaps are relatively small within the total 1473 draws in the archive but mean a few wins or jackpot shares might be missing.
Before 2016, draws were held once a week on Saturdays. Since 7 October 2015 (draw number 1479), Wednesday draws were introduced, roughly doubling the number of draws per year afterward. This detail helps explain changes in draw frequency and numbers of winners moving forward.
For anyone looking to build their own Lotto results spreadsheet, this archive is a useful foundation, and you can find guidance on how to build your own results spreadsheet.
The Year-by-Year Table
Here is a summary table showing, for each year from 2012 to 2026:
- Total draws held
- Number of draws with Powerball jackpot winners
- The biggest Powerball jackpot share won that year
- Date of the biggest jackpot win
| Year | Draws | Powerball Wins | Biggest Powerball Share ($) | Date Biggest Win |
|---|---|---|---|---|
| 2012 | 43 | 8 | 26,264,932 | 31 Mar 2012 |
| 2013 | 52 | 6 | 15,000,000 | 26 Jan 2013 |
| 2014 | 52 | 7 | 26,061,898 | 22 Feb 2014 |
| 2015 | 65 | 13 | 23,800,822 | 27 Jun 2015 |
| 2016 | 105 | 10 | 44,000,000 | 9 Nov 2016 |
| 2017 | 104 | 13 | 30,250,000 | 16 Sep 2017 |
| 2018 | 104 | 15 | 22,333,333 | 15 Aug 2018 |
| 2019 | 104 | 15 | 22,333,333 | 2 Jan 2019 |
| 2020 | 105 | 17 | 25,111,111 | 29 Feb 2020 |
| 2021 | 104 | 20 | 42,200,000 | 20 Oct 2021 |
| 2022 | 95 | 15 | 28,166,667 | 26 Mar 2022 |
| 2023 | 103 | 19 | 37,125,000 | 16 Aug 2023 |
| 2024 | 104 | 15 | 44,066,667 | 10 Aug 2024 |
| 2025 | 105 | 16 | 23,333,333 | 23 Apr 2025 |
| 2026 | 77 | 11 | 28,250,000 | 5 Sep 2026 |
This table provides a clear year-by-year reference for anyone interested in NZ Lotto winning numbers history and Powerball results history NZ.
The Wednesday Draw Arrives (From 7 October 2015)
Until 2015, there was only one Lotto draw per week, on Saturdays. Starting 7 October 2015, a second weekly draw was added on Wednesdays. This change effectively increased the total number of draws per year from around 52 to more than 100, by 2016 and continuing onwards.
The increase in draws naturally affected the total number of jackpot wins and the opportunities for players to win. For instance, 2015 had 65 draws as it transitioned to twice weekly, then 2016 had 105 draws. This is roughly double the draws of previous years, helping explain the higher total Powerball wins from then onwards compared to earlier years.
Adding a midweek draw gives the game a more regular rhythm and more draws to take part in, but it does not change the fundamental odds. The odds of winning the main Lotto division remain fixed at 1 in 3,838,380 and for Powerball at 1 in 53,737,320 per ticket. Every draw is still an independent random event.
The Busiest and Quietest Years for Jackpot Winners
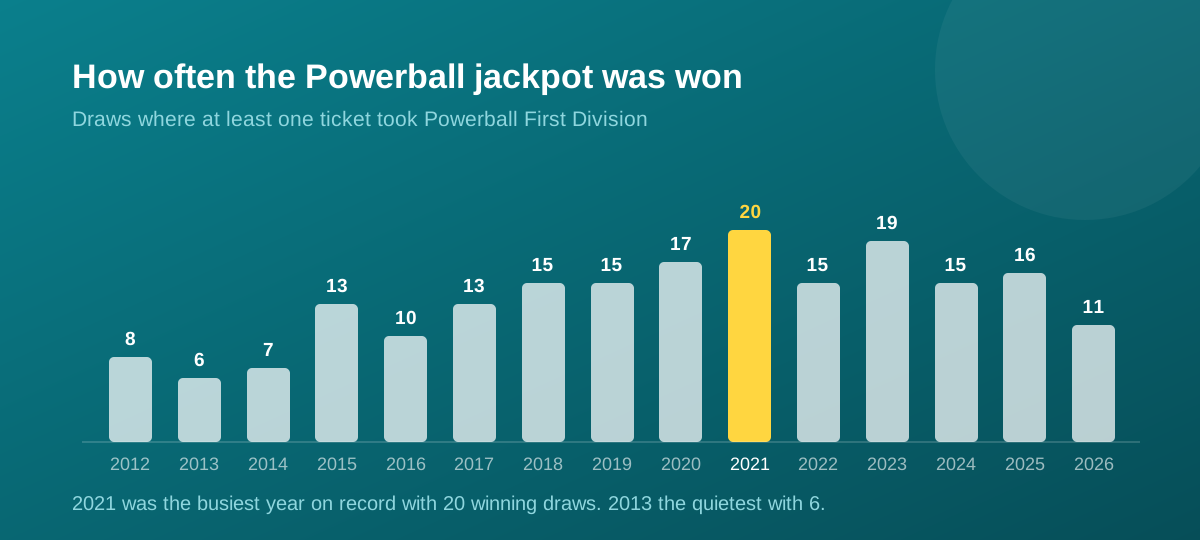
Looking at the number of draws with Powerball jackpot winners each year reveals some variation. The quietest year since 2012 was 2013, with only 6 winning draws out of 52. The busiest year was 2021, with 20 winning Powerball draws from 104 draws. The years around 2020 and 2021 also saw consistently higher numbers of winning draws, often around 15 to 20.
The number of winning draws depends on how many times the jackpot rolls over — that is, goes without a winner. Years with many rollover jackpots tend to have fewer winning draws but larger jackpots when won. Years with fewer rollovers tend to have more winners but smaller jackpot shares.
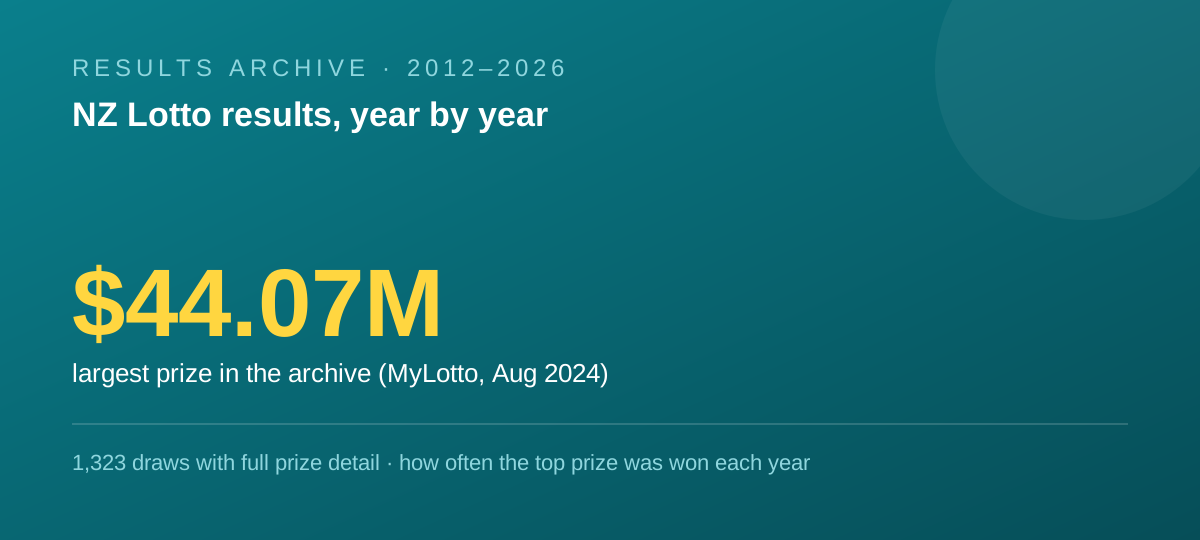
For example, the largest single Powerball share recorded in this archive was $44,066,667 won on 10 August 2024 at MyLotto in Auckland. The second largest was $44,000,000 won on 9 November 2016 at Dairy Flat Food Mart in Hibiscus Coast. Both reflect jackpots that rolled over multiple times before being won.
To understand rollovers and how they affect jackpot sizes and winning frequency, see how the rollover ladder works and how jackpot limits and Must Be Won work.
Reading a Table Like This Without Being Fooled By It
Tables with yearly Lotto results can suggest patterns, but it’s important to remember several key facts:
- Each Lotto and Powerball draw is an independent event with fixed odds: 1 in 3,838,380 for Lotto division 1, and 1 in 53,737,320 for Powerball division 1.
- A larger number of draws per year (from 2016 onwards, due to Wednesday draws) means more draws to take part in, but the odds on any single line are unchanged.
- The number of Powerball wins per year varies partly because of rollovers. Many rollovers mean fewer winning draws but larger jackpots.
- Missing draws from the archive (late 2012 and mid 2022) mean this data is not perfectly complete.
When you look back over this NZ Lotto results archive, the steady increase in draws from 2015 and the variation from year to year in jackpot wins and sizes make sense as natural outcomes of chance combined with how the game is structured.
This archive is useful for players interested in NZ Lotto results history or tracking Powerball results history NZ over time, but it does not and cannot predict future results.
For deeper historical context, see our record of the biggest wins in NZ history.
If gambling stops being fun, free support is available from the Gambling Helpline on 0800 654 655.
Quick answers
What years does the NZ Lotto results archive cover in full detail?
The NZ Lotto results archive covers full prize details from 2012 to 2026. Earlier years like 2001 to 2003 have only draw numbers and winning numbers without prize or jackpot data.
When was the Wednesday Lotto draw introduced in New Zealand?
The Wednesday Lotto draw started on 7 October 2015, increasing the number of weekly draws from one to two and roughly doubling draws per year from 2016.
Which year had the most Powerball jackpot winning draws since 2012?
The year with the most Powerball jackpot winning draws was 2021, with 20 winning draws out of 104 draws total.
What is the largest Powerball jackpot share recorded in the archive?
The largest Powerball jackpot share recorded was $44,066,667 won on 10 August 2024 at MyLotto in Auckland, often quoted as $44.07 million.

Fancy your own set of numbers?
I'll pick 30 fresh lines for the next draw — hot, balanced and wild card.