
Our Three Strategies, 1,323 Draws Later: What the Trend Really Shows

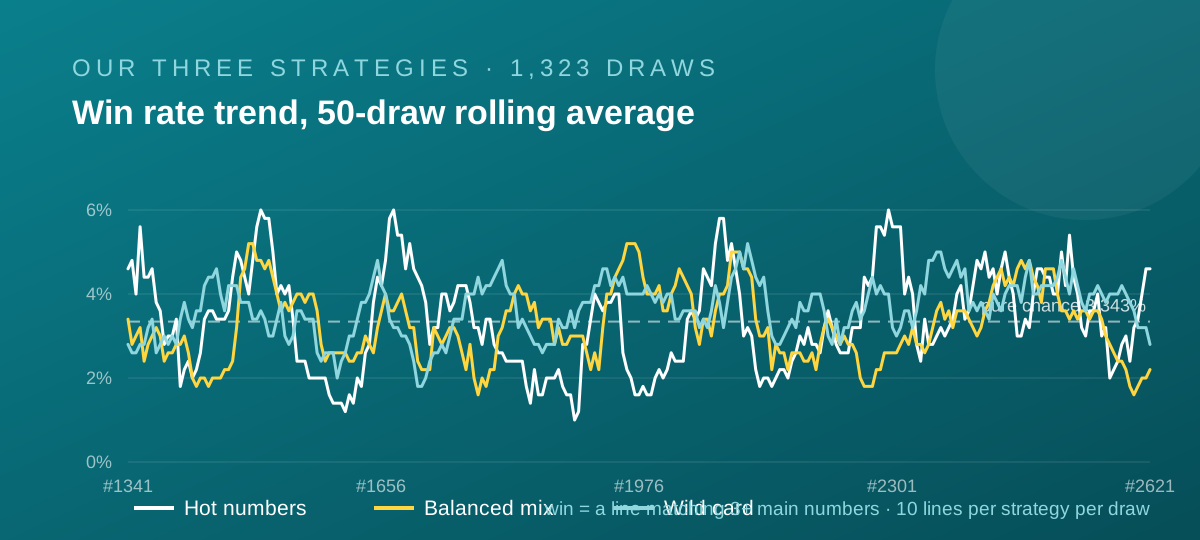
Every line this site publishes carries one of three labels, so a fair question is how the three of them actually perform. Rather than assert an answer, we ran them properly: a walk-forward backtest across 1,323 draws, with each strategy's 10 lines built only from the draws that came before it, then scored against the draw that followed.
What the three strategies actually are
It helps to be precise about what is being tested, because the names carry a lot of implication.
- Hot numbers - six numbers drawn at random from the 15 most frequent balls so far. Hot, but a fresh line every time.
- Balanced mix - three hot, two mid-pack (ranks 16-25) and one cold (bottom 15) number. The most structured of the three.
- Wild card - a frequency-weighted draw across all 40 numbers, without replacement, where hotter balls are slightly more likely but anything can come up.
All three are built from the same frequency table. What differs is how tightly each one concentrates around the hot end of the board.
The trend chart
Each line is a 50-draw rolling average of that strategy's win rate, where a win means a line matched three or more main numbers - the same thing that pays Lotto Division 7. Ten lines per strategy per draw, so 13,230 lines each across the run.
Reading the three lines honestly
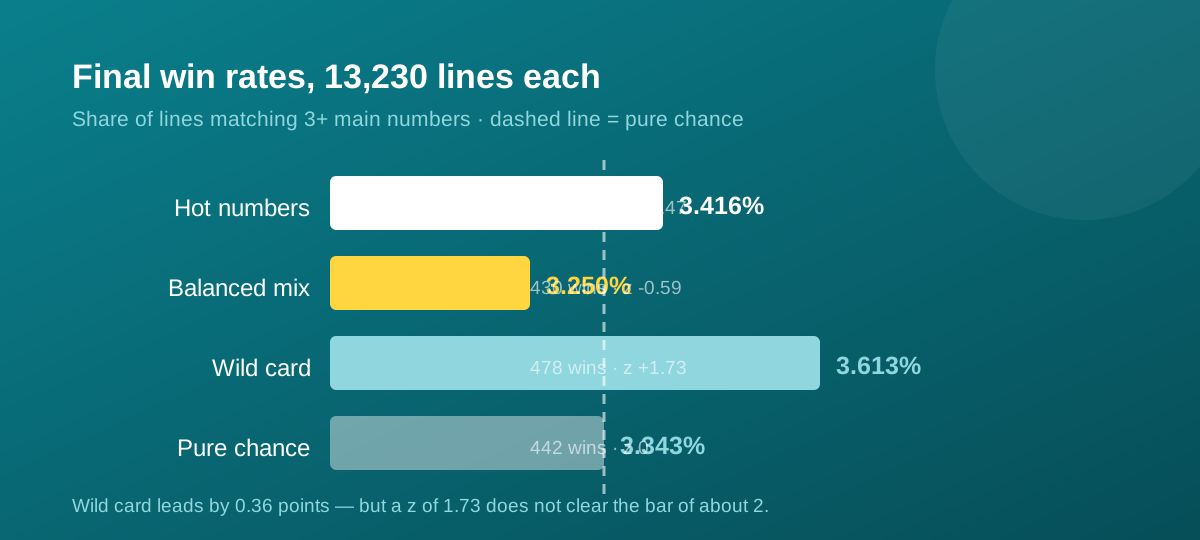
| Strategy | Wins | Per draw | Win rate | vs chance |
|---|---|---|---|---|
| Hot numbers | 452 | 0.342 | 3.416% | +0.47 |
| Balanced mix | 430 | 0.325 | 3.250% | -0.59 |
| Wild card | 478 | 0.361 | 3.613% | +1.73 |
| Pure chance | 442 | 0.334 | 3.343% | 0 |
Three things worth saying plainly.
They are all the same line. Look at the chart and the three traces cross each other constantly. No strategy leads for long, and none of them separates from the chance line at 3.343%.
Wild card finished top - and it still does not clear the bar. Its z-score is +1.73. To describe a result as genuinely better than chance you want roughly 2. At 1.73 we cannot separate it from luck, and when three strategies are compared at once, seeing one of them reach about 1.7 is unremarkable.
The spread is what noise looks like. A gap of 0.36 percentage points between best and worst, across 13,230 lines each, is precisely the range you expect when nothing real is happening.
Our own live rounds tell the same story
We also keep a public record of the rounds actually published on this site - every line scored against the draw that followed, wins and misses alike:
| Strategy | Lines | Wins | Win rate |
|---|---|---|---|
| Hot numbers | 195 | 5 | 2.564% |
| Balanced mix | 195 | 6 | 3.077% |
| Wild card | 190 | 7 | 3.684% |
Twenty-four rounds is a small sample, and every result sits within a whisker of chance. Wild card happens to lead here as well, which is a pleasant coincidence rather than evidence - change the random seed and the order reshuffles.
Why those lines have to be flat
There is a mathematical reason the chart looks the way it does, and it is worth stating without decoration.
For any drawn combination of six numbers, every possible six-number line has the same probability of matching three or more of them - about 3.343 per cent. That is not an approximation of the game; it falls straight out of the arithmetic, and it holds whatever numbers you write down.
So the frequency table is real, and the strategies genuinely produce different lines. What they cannot do is change the expected number of winners, because the draw has no idea which pool a line came from. A strategy shapes the distribution of your results. It never touches the average.
What the strategies are actually for
If none of them wins more often, why publish three at all?
- Structure instead of paralysis. Choosing six numbers from forty is tedious. Three strategies give every line a reason behind it rather than a blank form.
- Spread across the board. A Hot-only set concentrates everything inside fifteen numbers. Wild card touches the whole board, and not clustering is the one thing that genuinely affects your outcome - not by helping you win, but by reducing how many other people share the prize when you do.
- Honest range. Some players want the hot end, some want a spread, some want a weighted random draw. Publishing all three keeps the choice real instead of pretending one of them is superior.
The honest conclusion
1,323 draws, 39,690 lines, and three strategies that cannot be told apart from each other or from pure chance. That chart is not a disappointing result. It is what a fair game is supposed to look like - and the reason we publish the whole record instead of the parts that flatter us.
Pick the strategy you enjoy looking at. The numbers will do exactly what they were always going to do.
If gambling has stopped being entertainment for you or someone close to you, Gambling Helpline NZ is free, confidential, and available 24/7 on 0800 654 655.

Fancy your own set of numbers?
I'll pick 30 fresh lines for the next draw — hot, balanced and wild card.