
Daylight Saving vs Standard Time: What 1,321 NZ Lotto Draws Actually Show

Quick note before we start: New Zealand moves to daylight saving at 2am on Sunday 27 September 2026, and back to standard time at 3am on Sunday 4 April 2027. Tonight's draw is the last one played under standard time this season.
Every clock change, the same questions come around. Does the hour shift change anything about Lotto? Do summer draws behave differently from winter ones? Is there a season where your numbers do better?
So I did the thing I always do: went to the data. I split 1,321 NZ Lotto draws — every draw from 2012 to this week where we hold full division-by-division prize data — by which side of the clock change they fell on, and compared everything that can be compared.
The short answer is no, the clock changes nothing. The draw machine has no idea what time it is, and neither do the balls. But the long answer turned up one pattern that is genuinely real, and one that only looks real. Both are worth knowing.
What the split looks like
A draw counts as daylight saving here if it fell on or after the last Sunday in September, and before the first Sunday in April — the actual New Zealand rule, not a rough monthly guess.
| Season | Draws analysed | Window | Powerball Div 1 won | Average Div 1 prize when won |
|---|---|---|---|---|
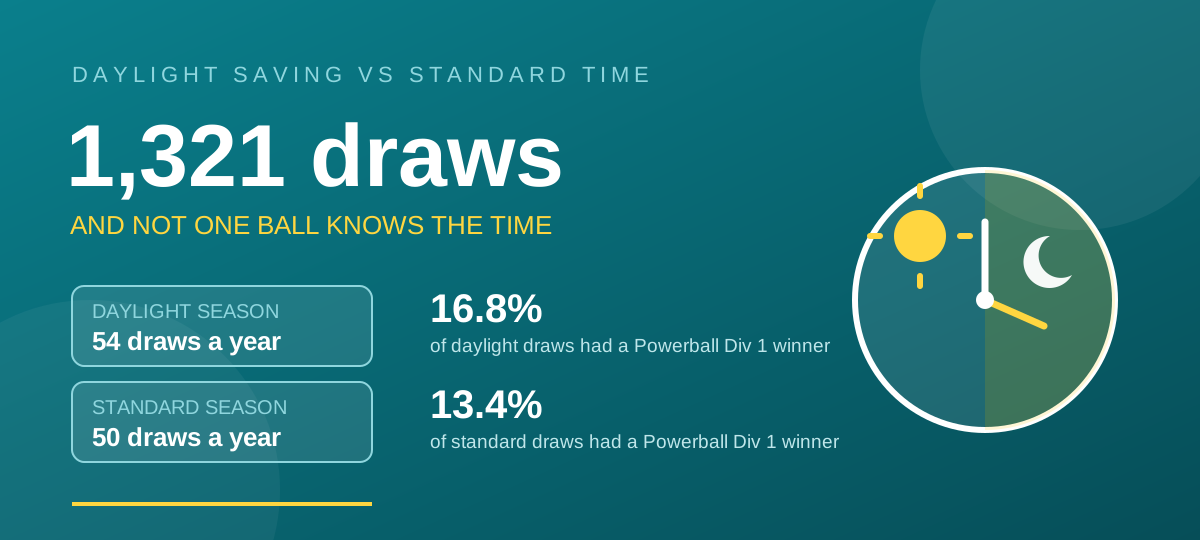
| Daylight saving (NZDT) | 680 | late Sep to early Apr | 16.8% | $11.10M |
| Standard time (NZST) | 641 | early Apr to late Sep | 13.4% | $12.55M |
The first thing worth noticing is quiet and practical: the daylight saving season runs 27 weeks, standard time runs 25. That works out to roughly 54 draws a year in daylight season and 50 in standard time — four extra draws a year, purely because the season is longer. It is the only extra thing the clock gives you.
The pattern that is not real: summer versus winter
On the surface, summer looks luckier:
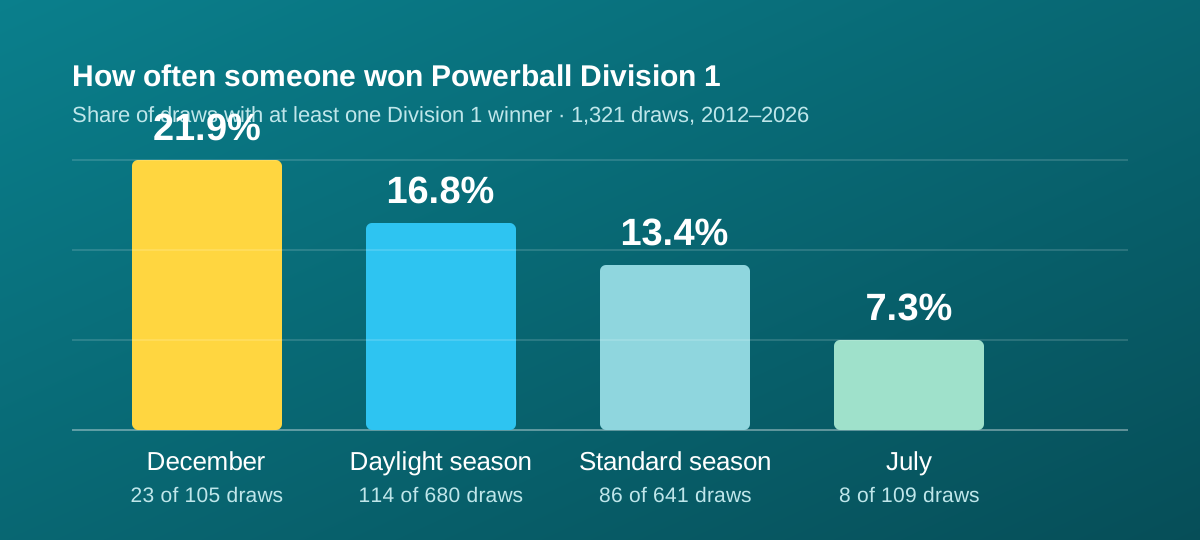
- Powerball Division 1 was won in 16.8% of daylight-season draws (114 of 680).
- It was won in 13.4% of standard-season draws (86 of 641).
- But the average winning Division 1 prize was smaller in daylight season — $11.10M against $12.55M in standard time (median $8.33M against $10.33M).
A three percentage-point gap sounds like something, until you check whether it is bigger than noise. It is not: the difference sits at about 1.7 standard errors, and with samples of 680 and 641 draws, a gap that size is entirely ordinary. Draw 680 random draws and 641 more, and you will see swings like this constantly. So no — summer does not make a draw any more likely to produce a winner.
The main game agrees. A Lotto Division 1 winner appeared in 84.6% of daylight draws and 83.6% of standard draws. Essentially the same number, across 1,321 draws of history.
The pattern that is real: December versus July
Here is where the data stops being boring.
- December: 105 draws, 23 of them produced a Powerball Division 1 winner — 21.9%.
- July: 109 draws, 8 of them did — 7.3%.
That is roughly a three-fold difference, and unlike the season split, this one survives a proper significance test (p of about 0.002 — the sort of gap that would show up by chance around twice in a thousand tries). Widen the window to the whole holiday stretch, 15 December to 5 January, and the pattern holds: 22.7% of those 75 draws produced a Division 1 winner, against 14.7% for the rest of the year.
What is going on? Almost certainly ticket sales, not astrology. December is the month people buy tickets they would never otherwise buy — presents, office pools, relatives visiting, the annual "I'll have a go" crowd — on top of heavy promotion around the biggest jackpots of the year. More tickets in play per draw means a higher chance that somebody matches. Same machine, same odds per line, many more lines sold. The game did not get easier; the room got fuller.
The flip side is visible too: December's winners took smaller average prizes ($8.48M) than July's ($11.06M). That fits the same mechanism. When jackpots are claimed more often, they do not get as long to build, so the cheque is smaller when it finally goes off. The mechanics of how far a jackpot can grow are in how the $60 million cap and roll-down work.
The clock-change weekend, specifically
I also pulled every Saturday draw that fell on the eve of a clock change — 29 of them since 2012. Powerball Division 1 was won in just 3 (about 10%), while main Lotto Division 1 was won in 22 of the 29. Neither number means anything on a sample that small, and I am not going to pretend otherwise.
There is, however, a practical lesson. The clock-change weekend is one of the easiest to get wrong as a player, because your body clock is an hour out: it feels earlier than it really is. Draws happen at 8pm on Wednesday and Saturday regardless of daylight saving, and ticket sales close well before that — the exact draw times and cut-off are here. On the weekend the clocks move, buy earlier than you usually would instead of trusting your sense of time.
Do the numbers themselves change with the season?
This is the question people actually want answered, so here it is. Our most-drawn main balls do differ a little between the two windows:
| Season | Most drawn main balls |
|---|---|
| Daylight saving | 24, 28, 12, 17, 40 |
| Standard time | 10, 35, 19, 29, 32 |
And Powerball's most reliable performer appears on both lists: the number 1 is top-five in daylight season and top-five in standard time — no surprise, since it topped the old-era count outright with 168 appearances from 1,472 draws. Everything else in those two rows is noise. With roughly 680 draws per window, a ball coming up a handful more times than another is exactly what randomness looks like, not a seasonal signature.
If you want the full picture rather than a seasonal slice, the Powerball frequency breakdown covers every draw on record, and the complete 1 to 40 chart is on the number explorer.
One seasonal footnote worth knowing: the new 14-ball Powerball format began on 15 September 2026 — which was still standard time. Years of unchanged rules, and the change landed in winter. Wednesday night will be its first appearance in a daylight-season draw.
What to take from this
- The clock change does nothing to your odds. An hour of clock shift cannot reach into a random draw.
- Sales volume changes how often somebody wins, not whether you can predict it. December's high win rate is a crowd effect: more tickets, same 1-in-53.7-million chance per line.
- The one real seasonal difference is the number of draws — about 54 in daylight season against 50 in standard time, because daylight season is two weeks longer.
- Tonight, Saturday 26 September, is the last standard-time draw of the season. The first daylight-time draw is Wednesday 30 September.
Which brings the usual honest reminder. More draws and busier months do not change the maths of a single line, and if summer or winter genuinely mattered to the balls, 1,321 draws would have shown it by now. Play it as entertainment, spend what you would happily spend on a coffee, and enjoy the extra hour of evening light this week.
If gambling has stopped being entertainment for you or someone close to you, Gambling Helpline NZ is free, confidential, and available 24/7 on 0800 654 655.

Fancy your own set of numbers?
I'll pick 30 fresh lines for the next draw — hot, balanced and wild card.