
How long is the wait between Powerball jackpot wins in NZ?

The headline numbers for both games
When looking at how often Powerball hits its jackpot in New Zealand, the figures show it’s quite a rare event. Across 1,323 draws with full prize data, the Powerball jackpot was won in only 200 of those, which is about 15.1 per cent of the time. That leaves 1,123 draws where nobody claimed the jackpot.
By contrast, Lotto Division 1 jackpots show a very different pattern. Out of those same 1,323 draws, Lotto Division 1 winners appeared 1,113 times, a winning rate of 84.1 per cent. Only 210 draws went without a Division 1 winner.
Powerball jackpots start at $4,000,000 and can climb up to a cap of $60,000,000, with draws twice a week on Wednesdays and Saturdays. The odds of winning Powerball Division 1 are 1 in 53,737,320, much steeper than Lotto Division 1’s 1 in 3,838,380.
The distribution of Powerball gaps
To understand the wait between wins, we look at the distribution of jackpot gaps — the number of draws without a Powerball jackpot winner before the next win occurs.
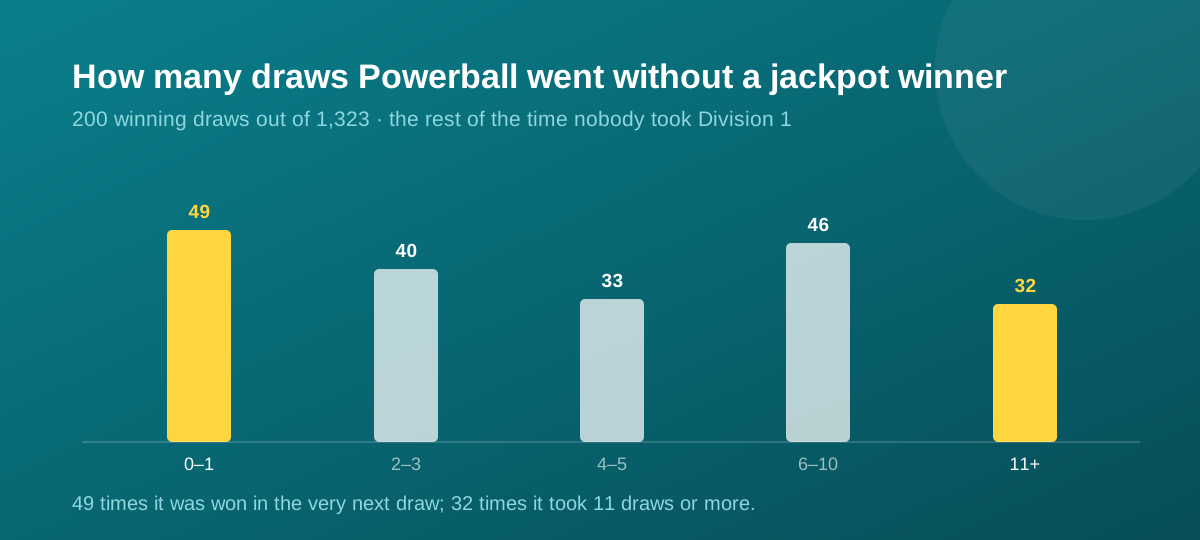
Out of the 200 Powerball jackpots won, the gaps between wins break down into these buckets:
- 0 or 1 draw gap: 49 times
- 2 or 3 draws gap: 40 times
- 4 or 5 draws gap: 33 times
- 6 to 10 draws gap: 46 times
- 11 or more draws gap: 32 times
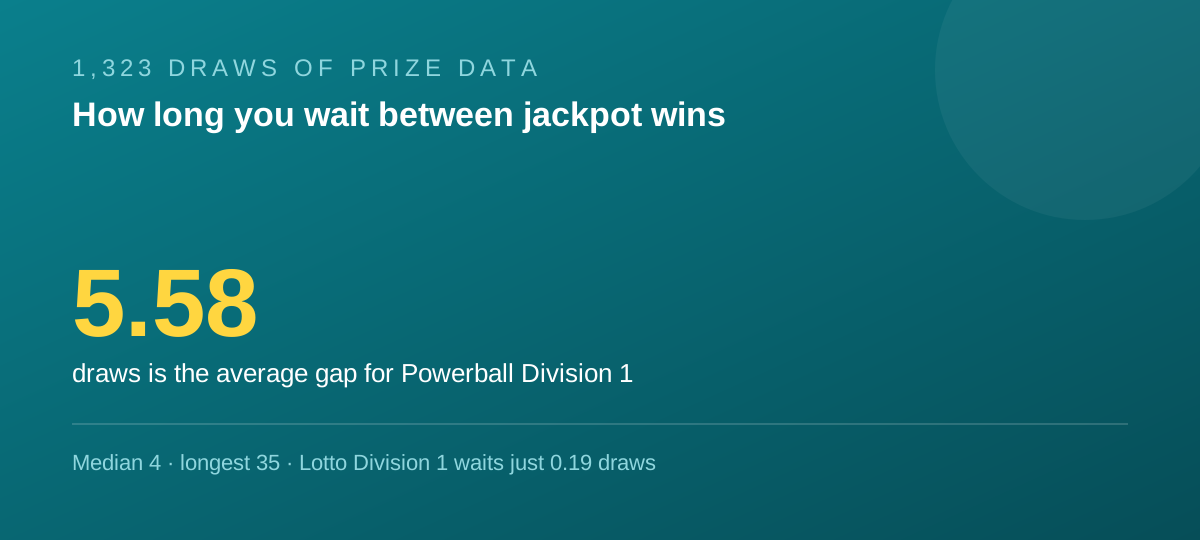
The average gap between Powerball wins is 5.58 draws, with a median of 4. This means roughly half the jackpot wins happened after 4 or fewer draws of no winner. The longest wait recorded was 35 draws without a winner, while the shortest gaps happened immediately in consecutive draws.
Currently, Powerball has run 7 draws without a jackpot winner.
The distribution of Lotto gaps, which looks nothing like it
Lotto Division 1 gaps tell a very different story. Most wins happen immediately or with hardly any wait. Here’s how the gaps stack up:
- 0 or 1 draw gap: 1,086 times
- 2 or 3 draws gap: 26 times
- 4 or 5 draws gap: 1 time
The average gap between Lotto Division 1 wins is only 0.19 draws with a median of 0. This shows jackpots are almost always won on the very next draw. The longest gap without a winner was 4 draws.
This is a stark contrast to Powerball’s distribution where longer gaps are common.
Why the shapes differ so much
The reason for these very different gap patterns comes down to the odds and the winning requirements. Powerball requires matching six numbers plus the Powerball, which is why the odds are 1 in 53.7 million. Lotto Division 1 needs six matching numbers only, with odds much easier at 1 in 3.8 million.
Because Powerball odds are so long, it naturally leads to longer and more varied jackpot gaps. Many draws can go by without anyone matching all the numbers. Lotto Division 1 jackpots are much more regularly won due to this lower difficulty, resulting in frequent and short gaps between winners.
The Powerball jackpot frequently rolls over when it isn’t won, causing the prize to grow larger and the wait to stretch longer. This is a key reason why Powerball jackpot gaps can stretch to 11 or more draws. You can read more on why Powerball keeps rolling over.
How often the prize was shared, not just won
Sharing the jackpot adds another layer to the story. Sometimes multiple tickets match the winning numbers in the same draw, splitting the prize.
For Powerball jackpots, this happened 14 times across the dataset. The largest number of winners on one Powerball jackpot was three tickets on 15 November 2025, who each took home $18,388,889.
Lotto Division 1 saw far more shared wins, with 754 jackpots split between two or more winners. The largest sharing happened on 19 September 2018, when 40 winners each received $25,000.
These shared wins show that even when jackpots are hit, the prize can be divided among multiple players.
What a distribution is not
Looking at these Powerball and Lotto jackpot gap distributions is useful for understanding how often wins happen and how long you might wait between them. But it’s important not to misunderstand what these stats mean.
Every draw is a random and independent event. Past gaps or frequencies do not influence future results. The distribution does not predict when the next jackpot will be won or how many draws will pass without a winner.
The shape of the distribution simply reflects the reality of the odds and the game structure over time. For example, longer gaps are common in Powerball because the odds are steeper, but that doesn’t mean the next draw is more or less likely to have a winner based on recent history.
If you’re curious about the randomness behind the draws, you can check out the randomness test on every draw.
In summary, Powerball jackpots in New Zealand are won roughly 15 per cent of the time, with waiting periods between wins that can stretch over many draws, while Lotto Division 1 jackpots are won far more frequently and with minimal waiting. The statistics show the difference in difficulty between the games and explain why Powerball jackpots often roll over multiple times, as explored in the 2026 rollover record.
For more context on the big wins, you might also find the biggest wins in NZ history interesting.
If gambling stops being fun, free support is available from the Gambling Helpline on 0800 654 655.
Quick answers
How often is Powerball won in New Zealand?
Powerball jackpots in New Zealand are won about 15.1 per cent of the time. Out of 1,323 draws with full prize data, there were 200 Powerball jackpot wins, showing that most draws result in no jackpot winner.
What is the typical wait time between Powerball jackpot wins?
The average gap between Powerball jackpot wins is 5.58 draws, with a median gap of 4 draws. The longest recorded wait was 35 draws without a winner, and the shortest was immediate consecutive wins.
How does Lotto Division 1 jackpot frequency compare to Powerball?
Lotto Division 1 jackpots are won far more often, with winners in 84.1 per cent of draws. The average gap between Lotto Division 1 wins is just 0.19 draws, meaning jackpots are almost always won in the next draw.
Does the jackpot gap distribution predict future wins?
No, the distribution only shows historical patterns over 1,323 draws. Each draw is random and independent, so past gaps do not provide any prediction or guarantee of when the next jackpot will be won.

Fancy your own set of numbers?
I'll pick 30 fresh lines for the next draw — hot, balanced and wild card.