
Is the NZ Lotto Draw Random? A Chi-Squared Test Analysis

What We Tested and Why
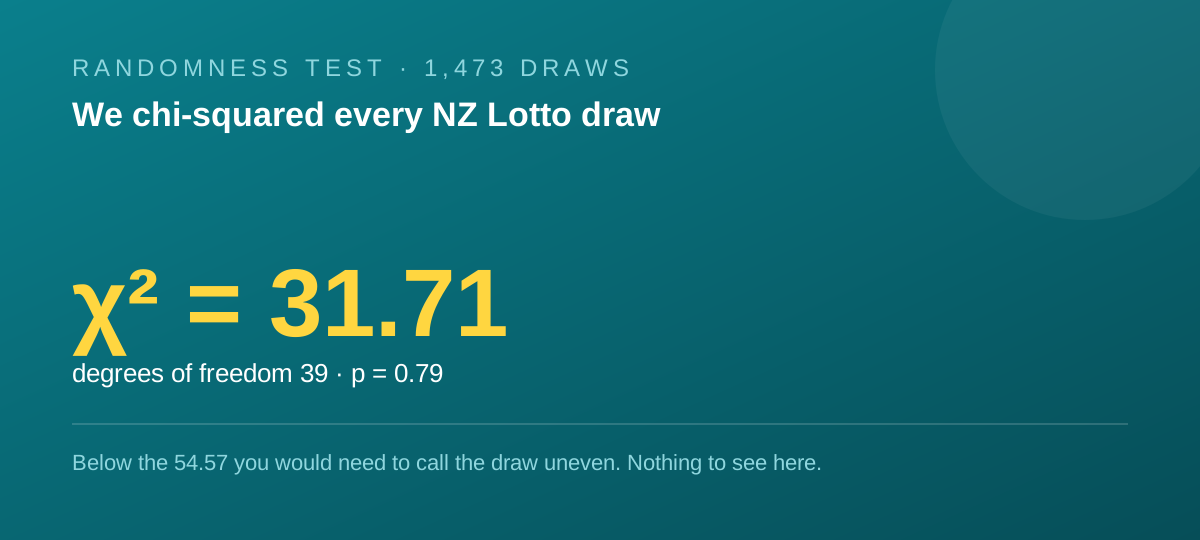
I wanted to know if the New Zealand Lotto draw really behaves randomly or if some balls come up more or less often than you’d expect from chance alone. To answer that, I analysed every Lotto draw in our archive, which covers 1,473 draws. Using these data, we ran a chi-squared test, a statistical method that compares the actual frequency each ball appears with what we would expect under pure randomness.
This test is widely used to check fairness because it measures how far observed results deviate from expected results. If that deviation is too large, it suggests the draws might not be random. But if the deviation is small, it supports the idea that each ball is equally likely to be drawn every time.
The Raw Spread Across 1,473 Draws
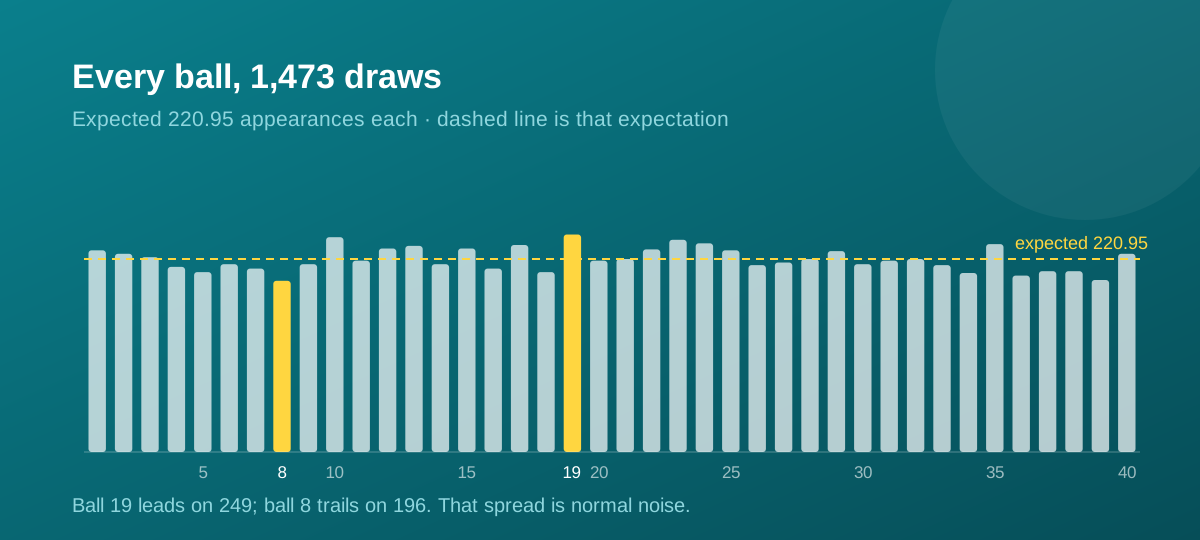
Across these 1,473 Lotto draws, there are six main balls drawn each time, so that makes 8,838 main ball slots in total (1,473 draws × 6 balls). Since there are 40 balls in the main pool, you’d expect each ball to appear about equally often if the draws are random.
The expected appearances per ball are 8,838 divided by 40, which is approximately 220.95 times for each ball.
Looking at the actual numbers, the most frequent ball was number 19, which appeared 249 times. The least frequent was ball 8, appearing 196 times. Here are the top five balls by frequency:
- Ball 19: 249 times
- Ball 10: 246 times
- Ball 23: 243 times
- Ball 24: 239 times
- Ball 35: 238 times
And the five least frequent were:
- Ball 8: 196 times
- Ball 39: 197 times
- Ball 36: 202 times
- Ball 34: 205 times
- Ball 18: 206 times
If you compare these counts to the expected 221 times or so, you can see some variation but nothing extreme given the number of draws.
What the Chi-Square Result Means
The chi-square statistic calculated from these data was 31.71. This value measures the summed squared differences between observed and expected counts, relative to expected counts. To understand if 31.71 is large or small, we compare it to a threshold based on the degrees of freedom, which in this case is 39 (one less than the number of balls).
For 39 degrees of freedom, the threshold to reject randomness at the 95 per cent confidence level is 54.57. Our test statistic of 31.71 is well below this threshold. The p-value—a number expressing how likely it is to see a result this extreme under randomness—is 0.79, meaning there is a 79 per cent chance we would see this or a more extreme difference if the draws were random.
In plain terms, this means the frequencies of balls in these Lotto draws fall comfortably within what we would expect from a fair random process. The data offers no evidence that the draw is anything but random.
To recap:
- Chi-square statistic: 31.71
- Degrees of freedom: 39
- p-value: 0.79
- 95 per cent threshold: 54.57
Since 31.71 < 54.57 and the p-value is high, we do not reject the hypothesis that the draws are random.
The Powerball Side of the Test
The Powerball draw has a different structure. Until September 2026, the Powerball pool held 10 balls, making the chance of matching the Powerball 1 in 10. Since then, the pool has 14 balls, changing the odds to 1 in 14. Our archive covers 1,469 draws from the old era with 10 balls.
For the Powerball old era, the expected number of appearances per ball was 146.9.
The chi-square test statistic for the Powerball old era was 14.86, with 9 degrees of freedom (number of Powerball balls minus one). The 95 per cent confidence threshold is 16.92.
The p-value in this case was 0.0949, or roughly 9.5 per cent. This suggests the observed distribution of Powerball numbers is consistent with randomness, though it skirts closer to the threshold than the main draw.
The most frequent Powerballs were:
- Ball 1: 168 times
- Ball 2: 163 times
- Ball 5: 161 times
The least frequent were:
- Ball 9: 123 times
- Ball 10: 127 times
- Ball 4: 134 times
While these differences exist, the chi-square test shows they are within the range expected from chance.
What This Does and Does Not Tell You
The key takeaway is that the Lotto draw is fair and random when tested across a large sample of draws. The balls do not show statistically significant biases or patterns that suggest manipulation or predictability.
However, this does not mean any specific number is "due" or more likely in a future draw. Randomness means every draw is independent, and past frequency does not influence next time's results. What might look like "hot" or "cold" numbers is just natural variation over time, not a reliable strategy.
If you want to explore more about what randomness actually feels like or how the balls are drawn and audited to ensure fairness, check these pages:
If you are curious about number frequency patterns and what number-preference research says, these may be helpful:
For those interested in strategies, here’s a look at real test results:
Remember, Lotto is a form of entertainment based on chance. Every draw is independent, and no method can guarantee a win.
If gambling stops being fun, free support is available from the Gambling Helpline on 0800 654 655.
Quick answers
What does a chi-square test tell us about NZ Lotto draws?
A chi-square test compares the actual frequency of each Lotto ball appearing with the expected frequency if the draw is random. In the NZ Lotto, the chi-square statistic of 31.71 on 39 degrees of freedom falls below the threshold needed to reject randomness, indicating the draws behave as expected from a fair random process.
Are some NZ Lotto balls more frequent than others?
Yes, there is natural variation. For example, ball 19 appeared 249 times while ball 8 appeared 196 times across 1,473 draws. But this variation is within what you’d expect by chance, so it does not mean the draw is biased.
Does the Powerball draw show the same randomness?
Testing the Powerball draws from the old era with 10 balls also supports randomness. The chi-square statistic was 14.86 with 9 degrees of freedom, below the 95 per cent confidence threshold, meaning no evidence against fair randomness.
Can these statistics help predict which numbers will win next?
No. Every draw is independent and equally random. Past frequency does not influence future results, so 'hot' or 'cold' numbers reflect past draws only and are not a strategy to improve your chances.
Fancy your own set of numbers?
I'll pick 30 fresh lines for the next draw — hot, balanced and wild card.